
Monitoring and optimizing website performance
A well-performing website not only improves user experience but also impacts accessibility, search engine rankings, conversion rates, and more. Maintaining optimal performance requires continuously monitoring your site to catch performance regressions.
This article explores key concepts related to a website's performance and why you should care. We share practical insights, tools, and techniques to help you monitor and improve your site's performance.
In this article, we'll cover:
- How to read network request waterfalls
- Common performance issues you might encounter
- How to handle large web page resources
- Tools you can use for testing your website's performance
- How to monitor your website's performance
- Techniques you can adopt to optimize performance
Page load performance vs. runtime performance
Although page load performance and runtime performance focus on different aspects of web performance, they are not entirely distinct concepts. Let's take a look at both:
Page load performance
Page load performance refers to the initial load of a web page. During page load, network requests are made to fetch resources like HTML, CSS, JavaScript, images, and fonts. This network activity can be visualized in a chart called a network request waterfall. This chart shows the order in which resources are downloaded and how long each resource takes to load.
Here are some useful metrics to know when discussing page load performance:
- Time to First Byte (TTFB): How fast the server responds with the first piece of data
- First Contentful Paint (FCP): How quickly the first content is displayed on the page
- Largest Contentful Paint (LCP): How quickly the main content is displayed on the page
Runtime performance
Runtime performance refers to how fast the browser can get pixels on the screen and how responsive the page is to user interactions.
Just because network resources have finished downloading doesn't mean anything meaningful is displayed on the screen. Runtime performance helps you understand how quickly the page becomes interactive and usable.
Some metrics related to runtime performance include:
- Interaction to Next Paint (INP): How responsive the page is to user interactions
- JavaScript execution: How fast the browser can execute JavaScript code
- Render performance: How quickly the page displays changes
Working with network request waterfalls
A network request waterfall is a visualization that shows how a browser loads web page resources over time. This helps you understand your page load experience. Most network request waterfall visualizations also include a filmstrip, a series of website screenshots showing how the page loads over time (shown in the Request Waterfall image below).
You can use our "Website Speed Test" to generate a network request waterfall for your website. This tool tests your website in a controlled lab environment and visualizes the network activity for you.
Note: Tools like DebugBear and browser developer tools are complementary means for investigating performance issues on your website. With both in your kit, you'll have a more complete approach to uncovering and solving performance problems.
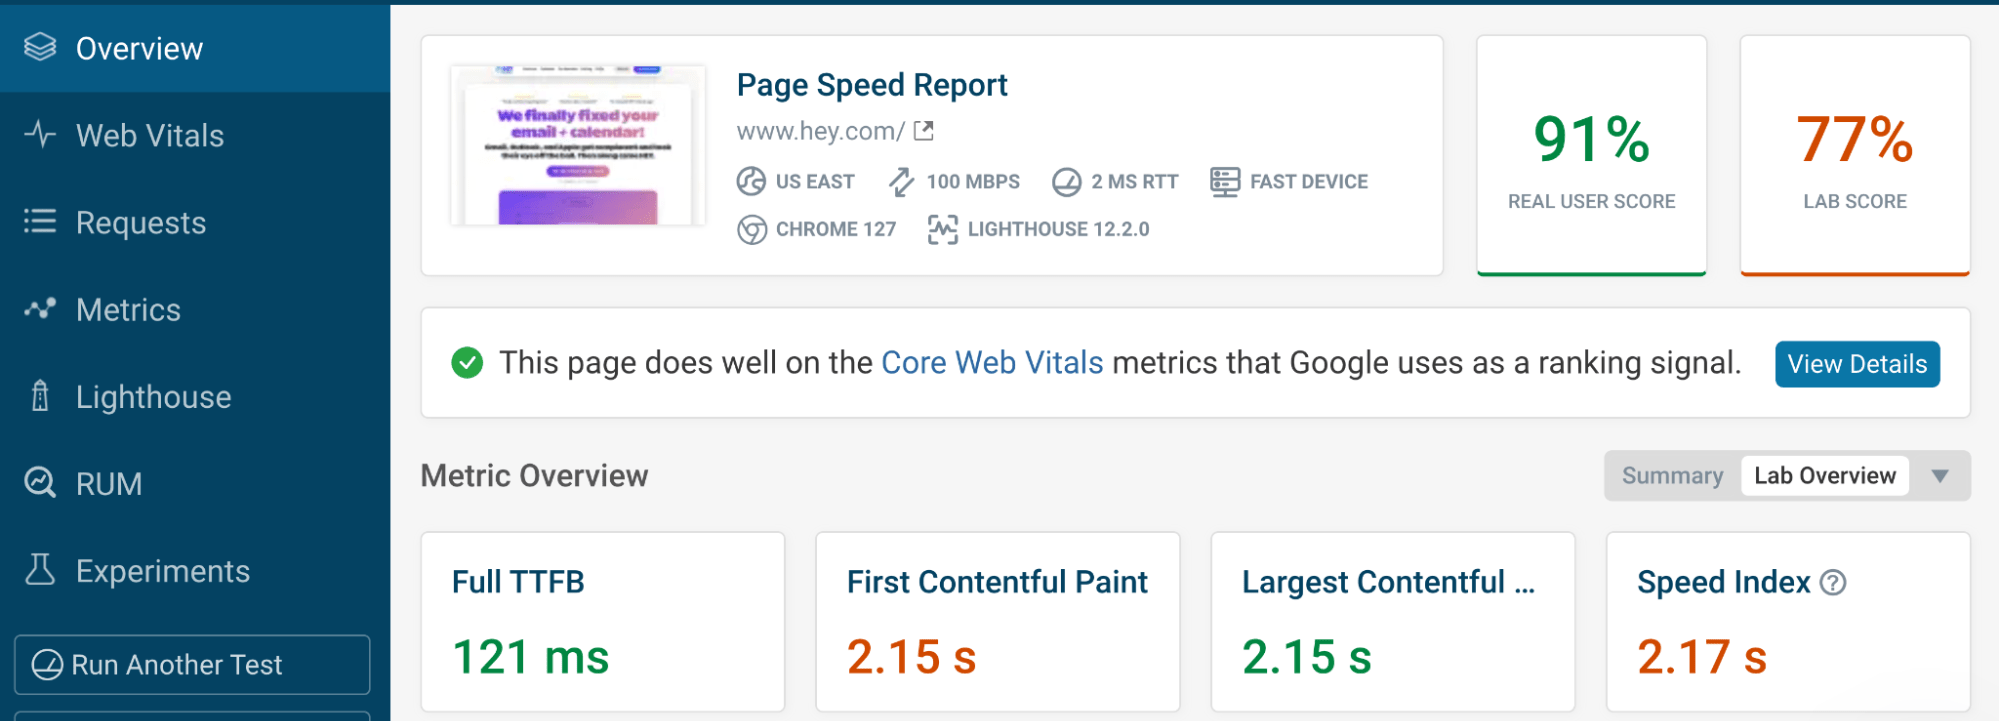
This report captures the page load experience of a website. It shows a number of useful performance metrics and provides links to additional data like a Lighthouse report and Requests for a waterfall view.
When you click the Requests option on the left pane, you're presented with a Request Waterfall view.
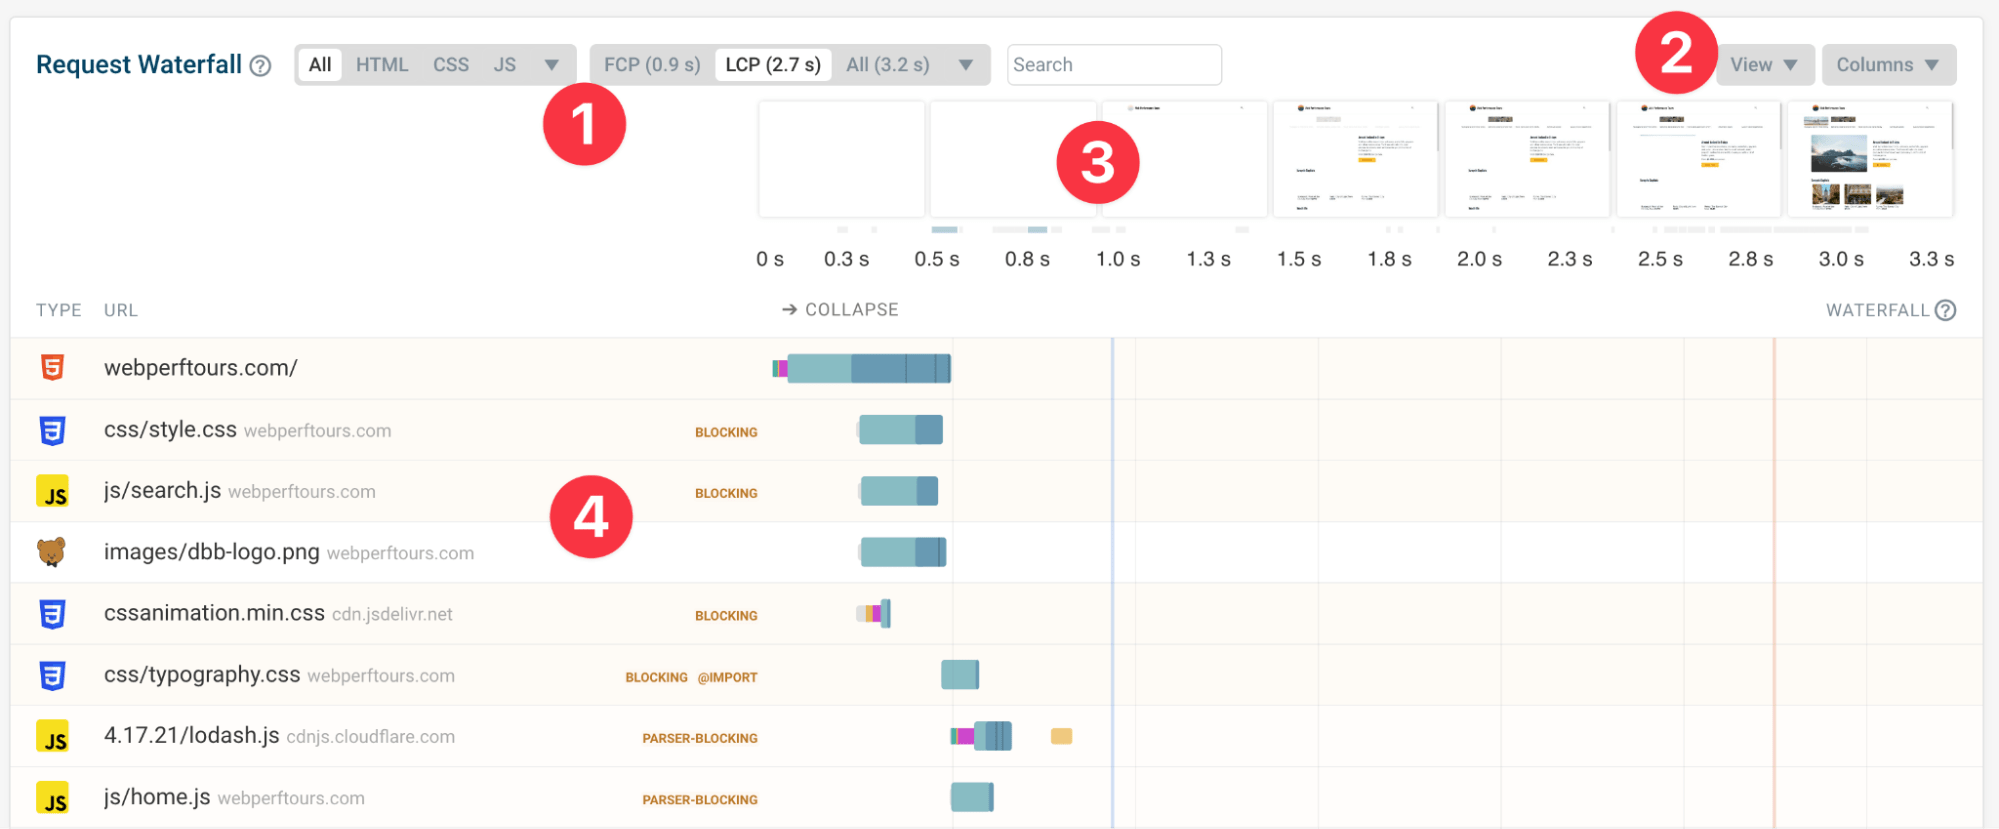
The numbered labels in the image above correspond to the following components:
- Filter options: Presents options to view only CSS resources or only HTML resources.
- View drop-down menu: Change the appearance of the filmstrip, and show/hide columns on the waterfall.
- Filmstrip view: Shows the visual progression of a page load as it was captured in this report.
- Requests: Lists the individual requests that happened during this recording.
In a waterfall diagram, each row represents a single network resource, such an HTML file, a CSS file, or an image file. Resources can vary significantly in these key aspects:
- Priority: Browsers prioritize resources based on their importance.
- Size: Resources can vary in size, affecting download times and bandwidth usage.
- Blocking behavior: Some resources can delay the loading of other resources.
- Type: Each type of resource has its own loading behavior, which is managed by the browser.
The top-to-bottom order of resources in a waterfall corresponds to the sequence in which resources are downloaded. You want critical resources closer to the top and less important resources towards the bottom.
Understanding waterfall metadata
DebugBear's network request waterfall view provides metadata for each request. Metadata is shown as columns for each resource row:

You can view additional metadata by clicking on an individual resource. To customize the metadata columns, click the "Columns" drop-down menu, and then toggle the columns you want to see. Some noteworthy metadata include:
- Priority: Indicates the browser's loading priority for the resource
- DNS: Time taken to resolve the domain name
- TTFB (Time to First Byte): Time it takes for the server to respond
- Full size: Uncompressed size of the resource
- Protocol: Network protocol used (e.g., HTTP/2, HTTP/3)
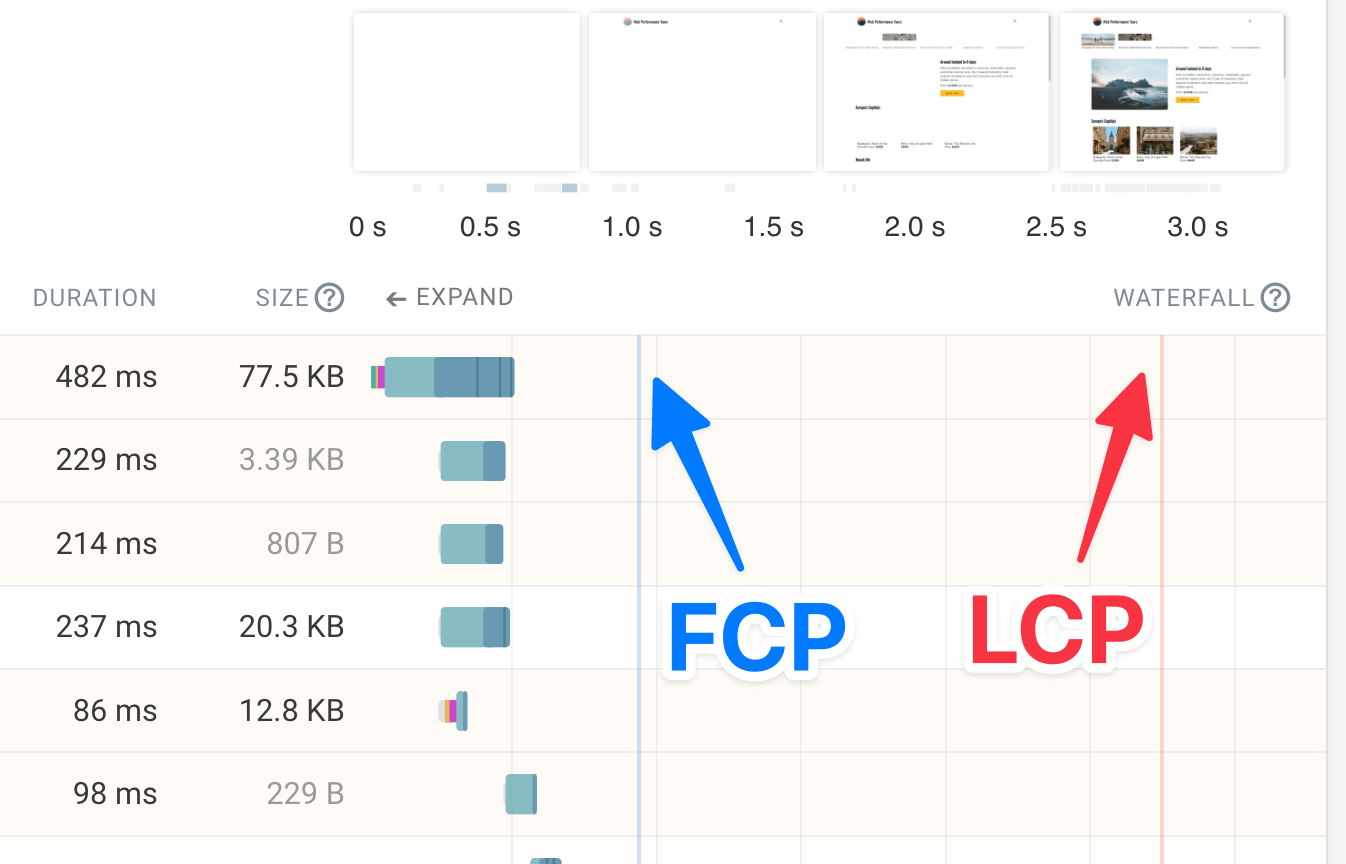
A network request waterfall chart shows rendering milestones. You can use the rendering milestones (shown as vertical coloured lines) to understand how network activity affects the page's rendering.
The red vertical line indicates the Largest Contentful Paint (LCP), while the blue line indicates the First Contentful Paint (FCP).
Using waterfall to identify performance issues
When analyzing a waterfall, look for patterns and issues that could be impacting your site's performance. Here are the three most common issues:
Render-blocking resources
Render-blocking resources are resources that delay the initial rendering of the page. Consider this code example:
<!doctype html>
<html lang="en">
  <head>
    <title>Online Shop</title>
  </head>
  <body>
    <p>Cookie banner</p>
    <script src="cookie-banner.js"></script>
    <h1>Shop for clothes</h1>
  </body>
</html>
In this case, the cookie-banner.js script blocks the rendering of the <h1> element.
In fact, many websites include render-blocking resources in the <head> element of the HTML document, which can delay the rendering of the entire page.
Whether it's CSS or JavaScript, DebugBear highlights render-blocking resources in the network request waterfall, making it easier to visualize where these issues occur:
In the case of render-blocking JavaScript files, you can apply the async attribute to the <script> element to prevent it from blocking the rendering of the page.
Long request chains
Long request chains occur when resources are dependent on each other, creating a cascade of requests. Here's an example of a request chain:
index.html (the first request):
<!doctype html>
<html lang="en">
  <head>
    <title>Online Shop</title>
    <script src="app.js"></script>
  </head>
  <body>
    <h1>Loading...</h1>
  </body>
</html>
app.js (the second request):
import analytics from "./analytics.js";
import home from "./home.js";

document.addEventListener("DOMContentLoaded", () => {
  analytics.init();
  home.init();
});
home.js (the third request):
function init() {
  const response = await fetch('/message');
  const message = await response.text();
  document.querySelector('h1').textContent = message;
}

export default { init };
This example shows an index.html file that loads an app.js file, which in turn loads a home.js file.
While this example is a simplification, it illustrates how long request chains can affect the page load experience.
Note:
The fact the /message endpoint is called only after the DOMContentLoaded event further exacerbates the issue because DOMContentLoaded is not needed to fetch the message over the network.
Browsers are very good at looking ahead and fetching resources that can be discovered from the main HTML file, but when long request chains are used, this ability is lost.
Missed preloading opportunities
Sometimes, critical resources aren't loaded as early as they could be. Often, early loading can be achieved by removing a critical resource from a long request chain and making sure that it's discoverable from the main HTML document; however, there are times when this isn't possible.
If a long request chain is unavoidable, you can mitigate the issue by using the <link rel="preload"> element for a critical resource, such as an LCP image element.
For example, following on from the previous long request chain example, the index.html file could be updated to preload the home.js file and the message endpoint, as shown below:
<!doctype html>
<html lang="en">
  <head>
    <title>Online Shop</title>
    <link rel="preload" href="home.js" as="script" />
    <link rel="preload" href="/message" as="fetch" />
    <script src="app.js"></script>
  </head>
  <body>
    <h1>Loading...</h1>
  </body>
</html>
Note:
You must not overuse <link rel="preload"> because it can lead to unnecessary resource downloads and increased bandwidth usage.
Chrome DevTools has a "LCP image loaded X seconds after the earliest start point" message in the Performance Panel. This can help you identify missed preloading opportunities. To locate this feature, use DevTools to make a performance recording of your page load, and then open up the LCP Request Discovery section from the Performance Insights sidebar.

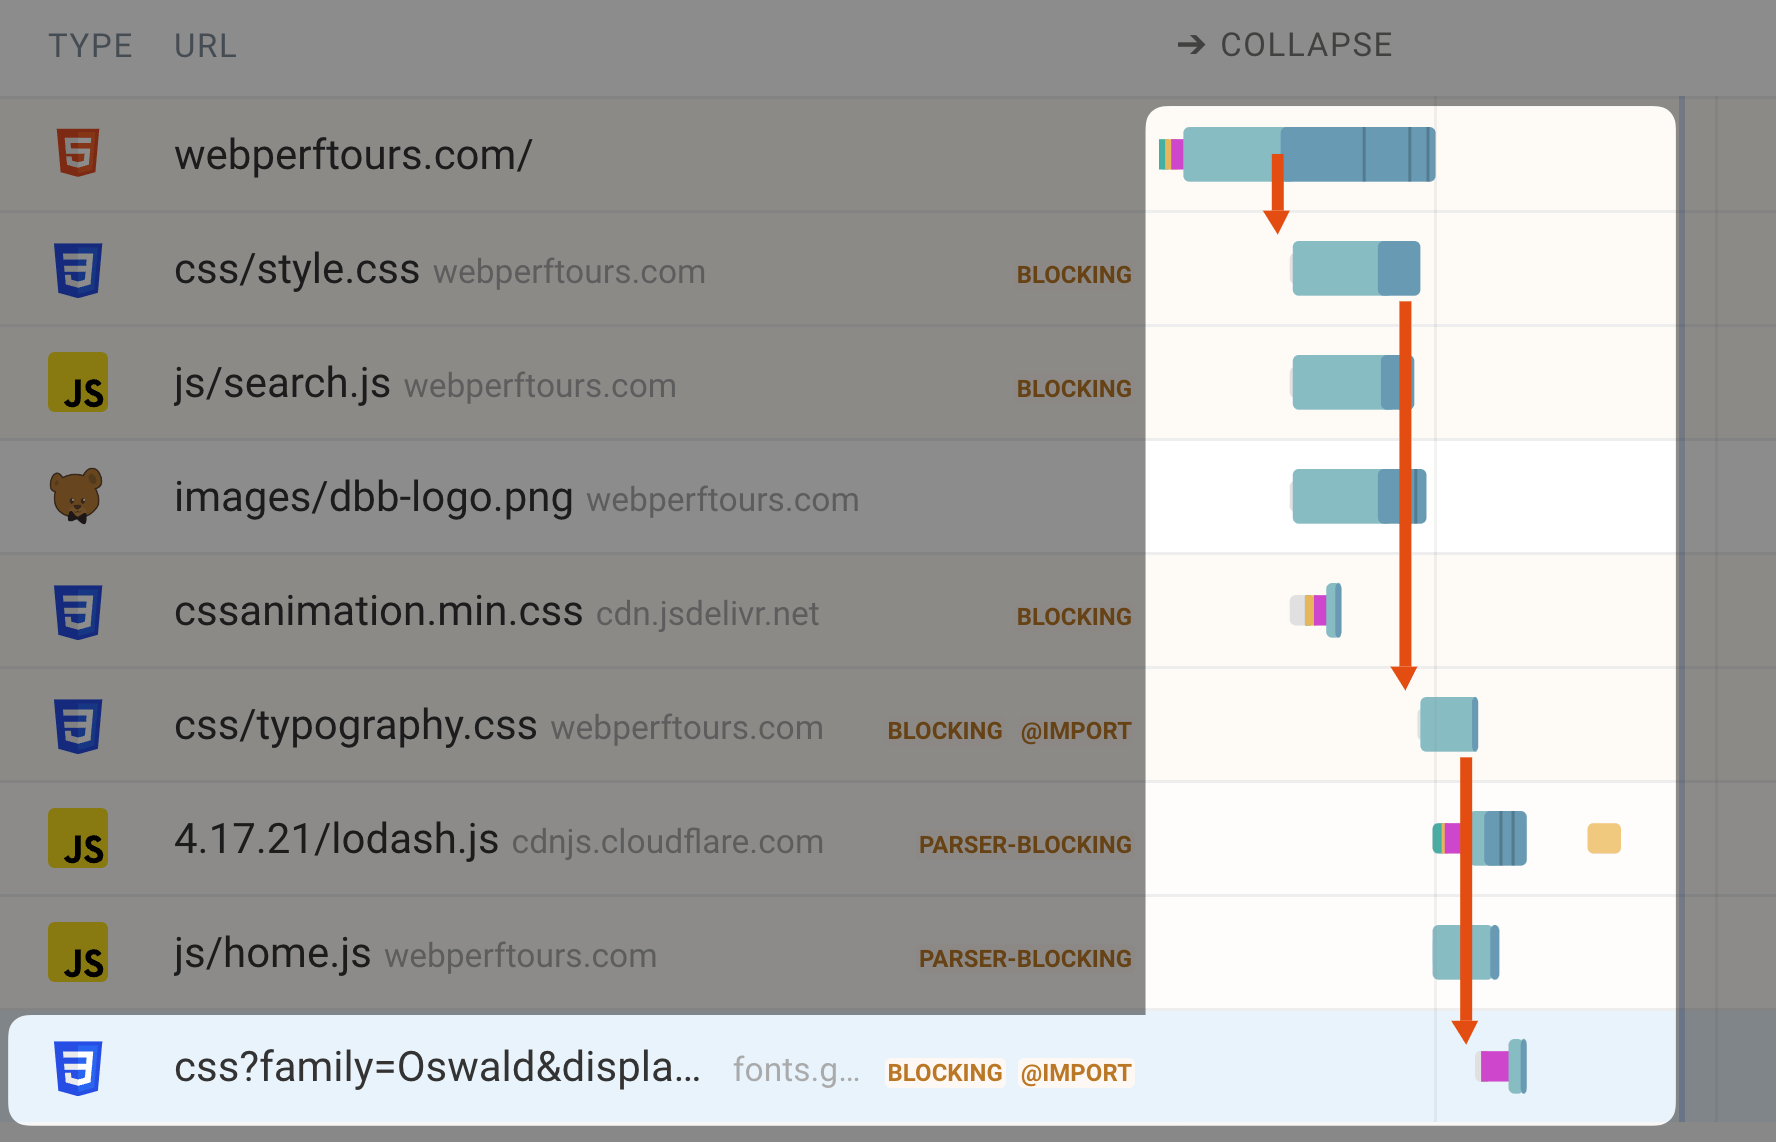
You can find long request chains in a DebugBear Request Waterfall view when you click on an individual resource, and toggle the "Show request initiator chain" setting to on.
The request chain in the following image shows that a font file (the last resource) is initiated by typography.css, which in turn is initiated by style.css, which is requested from the main document.
Handling large resources
Within the field of web development, it's generally understood that large resources can impact web performance. When your page includes large resources, it can lead to:
- Slower page load times overall
- Increased data usage, which can be costly for users on metered connections
- Higher battery consumption on mobile devices
- Bandwidth congestion, affecting the loading of other resources
Note: The impact of large resources isn't just in download time. Browsers also need to parse and execute code, even if unused, which can be especially time-consuming for large files.
How to Identify large resources
To find large resources, sort the resources in the waterfall view by size. In DebugBear, you can click the "Full size" or "Size" column header to sort resources by their uncompressed or compressed size, respectively. With the largest resources at the top, you can easily identify resources that are particularly large.
HTML / CSS size analysis
Large resources are often attributed to images, but the large size can also be caused by textual code/content, such as:
- HTML: Excessive markup in the main page document
- JavaScript: Large bundle sizes comprised of third-party libraries or unused code
- CSS: Bloated stylesheets with unused rules
DebugBear offers HTML and CSS size analyzer tools to help you break down the composition of these files. This can help you identify areas for improvement, such as removing unused styles or optimizing markup.
The following screenshot shows a size analysis for HTML markup.
In this example, a JavaScript framework has duplicated textual content on the page into a <script> element for the purpose of hydration.
Even with compression, this leads to wasted bytes down the network and additional parse time the browser needs to process the data within the <script> element.

JavaScript size analysis
For an in-depth analysis of JavaScript usage, the "Coverage" tab in browser DevTools (Edge or Chrome) can show you how much of your JavaScript (and CSS) is actually being used during page load.

While DebugBear doesn't offer a specific JavaScript size analyzer, you can use its JSON size analyzer tool if your bundle includes JSON data.
Ways to optimize the size of resources
In general, no matter how large your resources are, there are standard approaches to optimizing the size, including:
- Tree shaking: Remove unused code from your bundles.
- Code splitting: Split your code into smaller chunks to load only what's needed during page load. Defer non-critical code until it's needed or until the page has loaded.
- Compression: Reduce the size of your resources by using Brotli or Gzip for text-based files and modern formats like WebP or AVIF for images.
Optimizing page rendering
After your page resources are downloaded, the browser constructs the page and displays it on the screen. Some websites can have blazing fast resource load times but slow page rendering times, or vice versa. Here are some common rendering issues and how to address them.
Slow web fonts
Depending on the browser and any font-display CSS properties that have been set, using a web font that is slow to load can effectively block the rendering of the textual content on the page.
Even if a system fallback font is used initially, late-loaded web fonts can cause layout shifts, disrupting the user experience. This can happen as the browser initially renders the page with a fallback font, then swaps it out for the web font after it's loaded. If the fallback font and web font have different dimensions and metrics, it can cause layout shifts.
To mitigate these issues, you can do one or more of the following:
- If it's not critical for your web font to always be used, you can apply the
font-display: optionalorfont-display: fallbackCSS property to your font-face declaration. This lets the browser manage the display of your web font, balancing performance and user experience. At the very least, usefont-display: swap, which ensures the fallback font is used until the web font is loaded. - You can preload your web font file, which is often effective because fonts are sometimes specified in the CSS file. The CSS file loads after the HTML file, creating a request chain.
- You can use font face descriptors to better match the fallback font to the web font, reducing layout shifts.
Long JavaScript tasks
Long tasks are JavaScript operations that take more than 50ms to execute. This typically blocks the main thread and stops the browser from responding to user interactions. A long task that happens during page load can delay the rendering of the page. This is common with large JavaScript bundles, especially on mobile devices. DebugBear can highlight these long tasks in the network waterfall view.
You should break up long tasks into smaller chunks, or offload them to a Web Worker to run in the background.
Newer APIs like scheduler.yield can help you explicitly yield control back to the browser, allowing it to handle user interactions and do other rendering work.
Testing the performance of your website
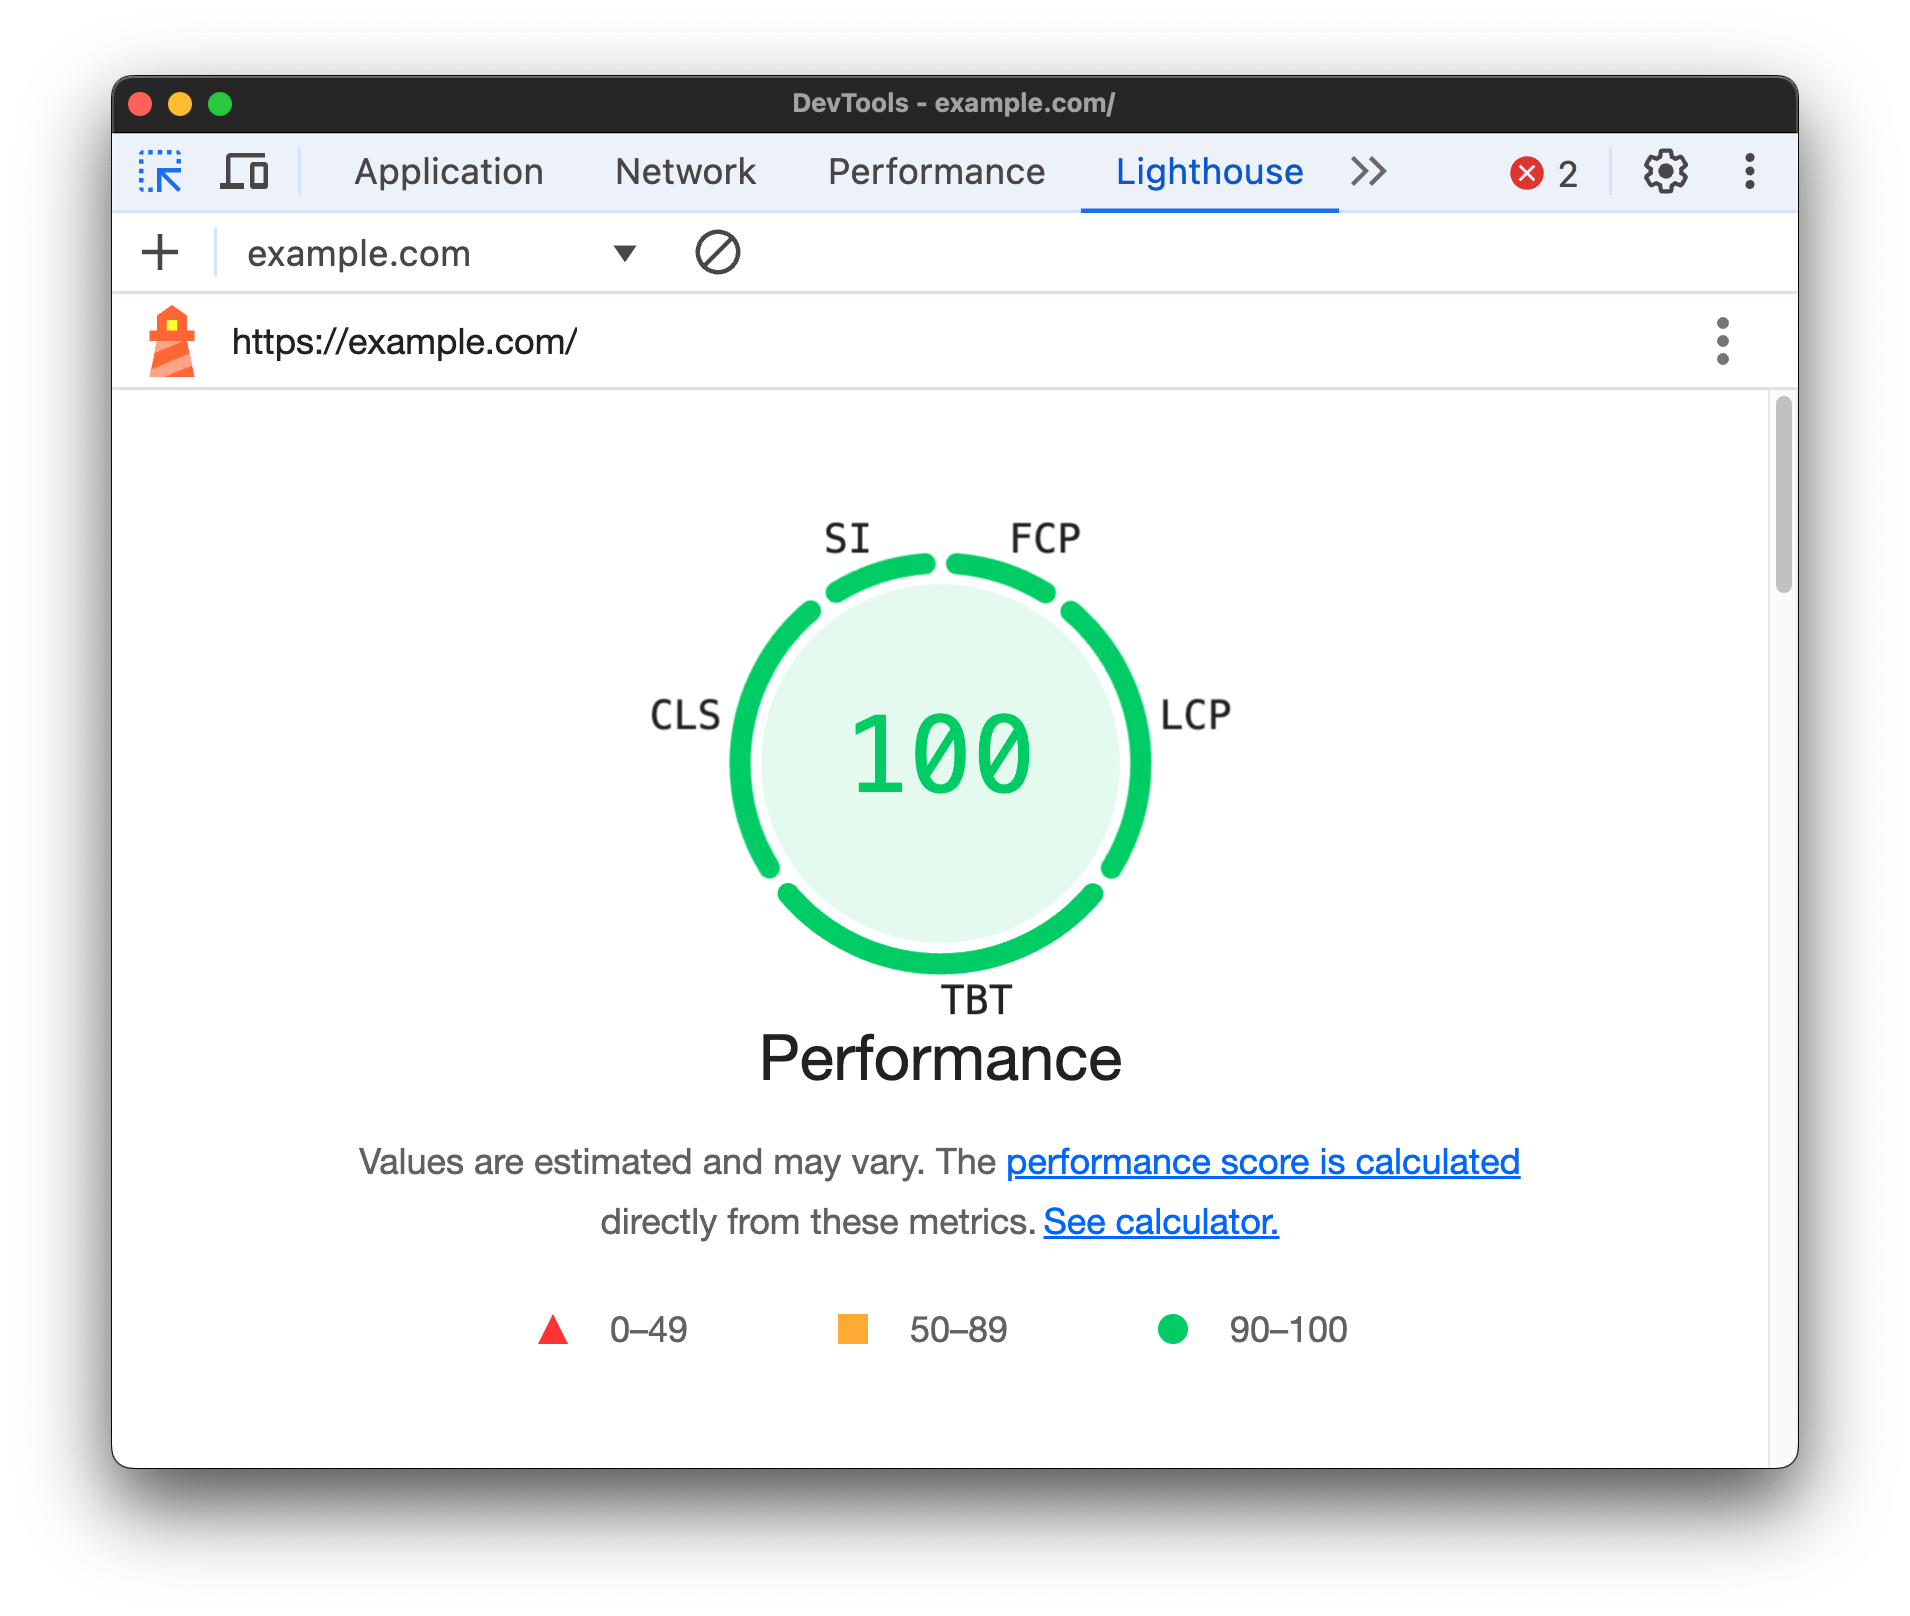
It's helpful to regularly test your website's performance as part of your development and debugging workflow. Here are some tools you can use to run quick performance tests on your websites:
Browser developer tools: Firefox, Chrome, Edge and Safari offer developer tools with performance profiling options.
PageSpeed Insights: Google's tool for analyzing web performance, providing a score and recommendations for improvement.
DebugBear: DebugBear offers a full suite of performance testing tools. You can run a free performance test to get a network request waterfall, Core Web Vitals scores, and much more.
Monitoring the performance of your website
While one-off tests are useful, continuous monitoring helps your site maintain good performance over time. With continuous monitoring, you can:
- Identify performance regressions.
- Track performance trends.
- Receive alerts for critical issues.
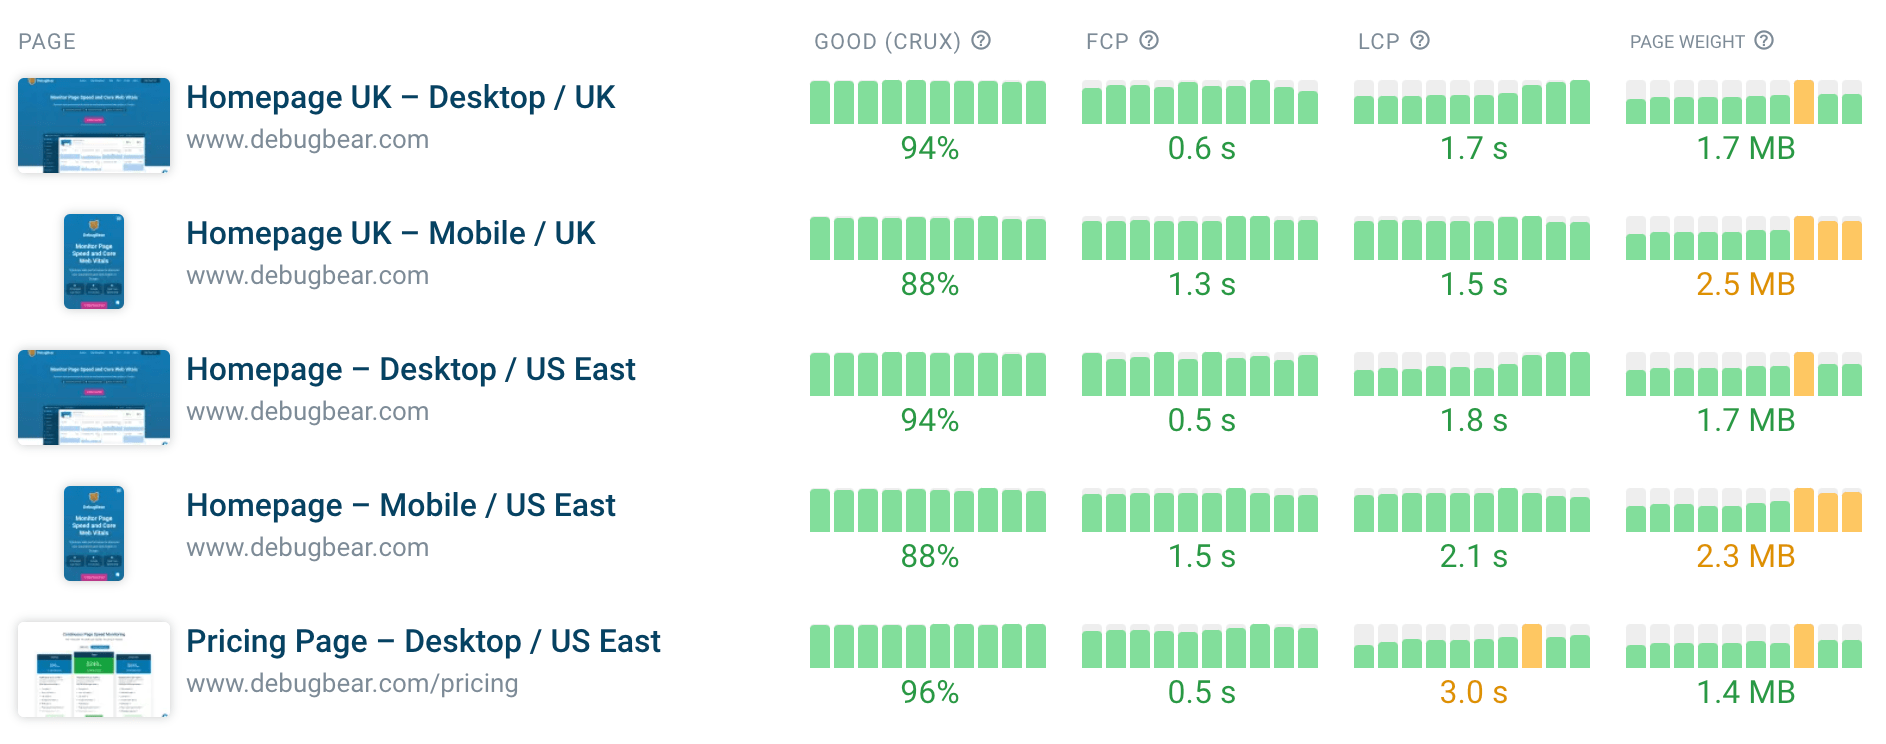
DebugBear offers ongoing performance monitoring with alerts, trend analysis, real user monitoring, customized reporting, and other reports.
For example, when your users report that the website feels slower, you can compare test results to identify which changes on your website impacted the performance. The following image shows performance trends for a list of web pages tracked on DebugBear.
Lab vs. field data
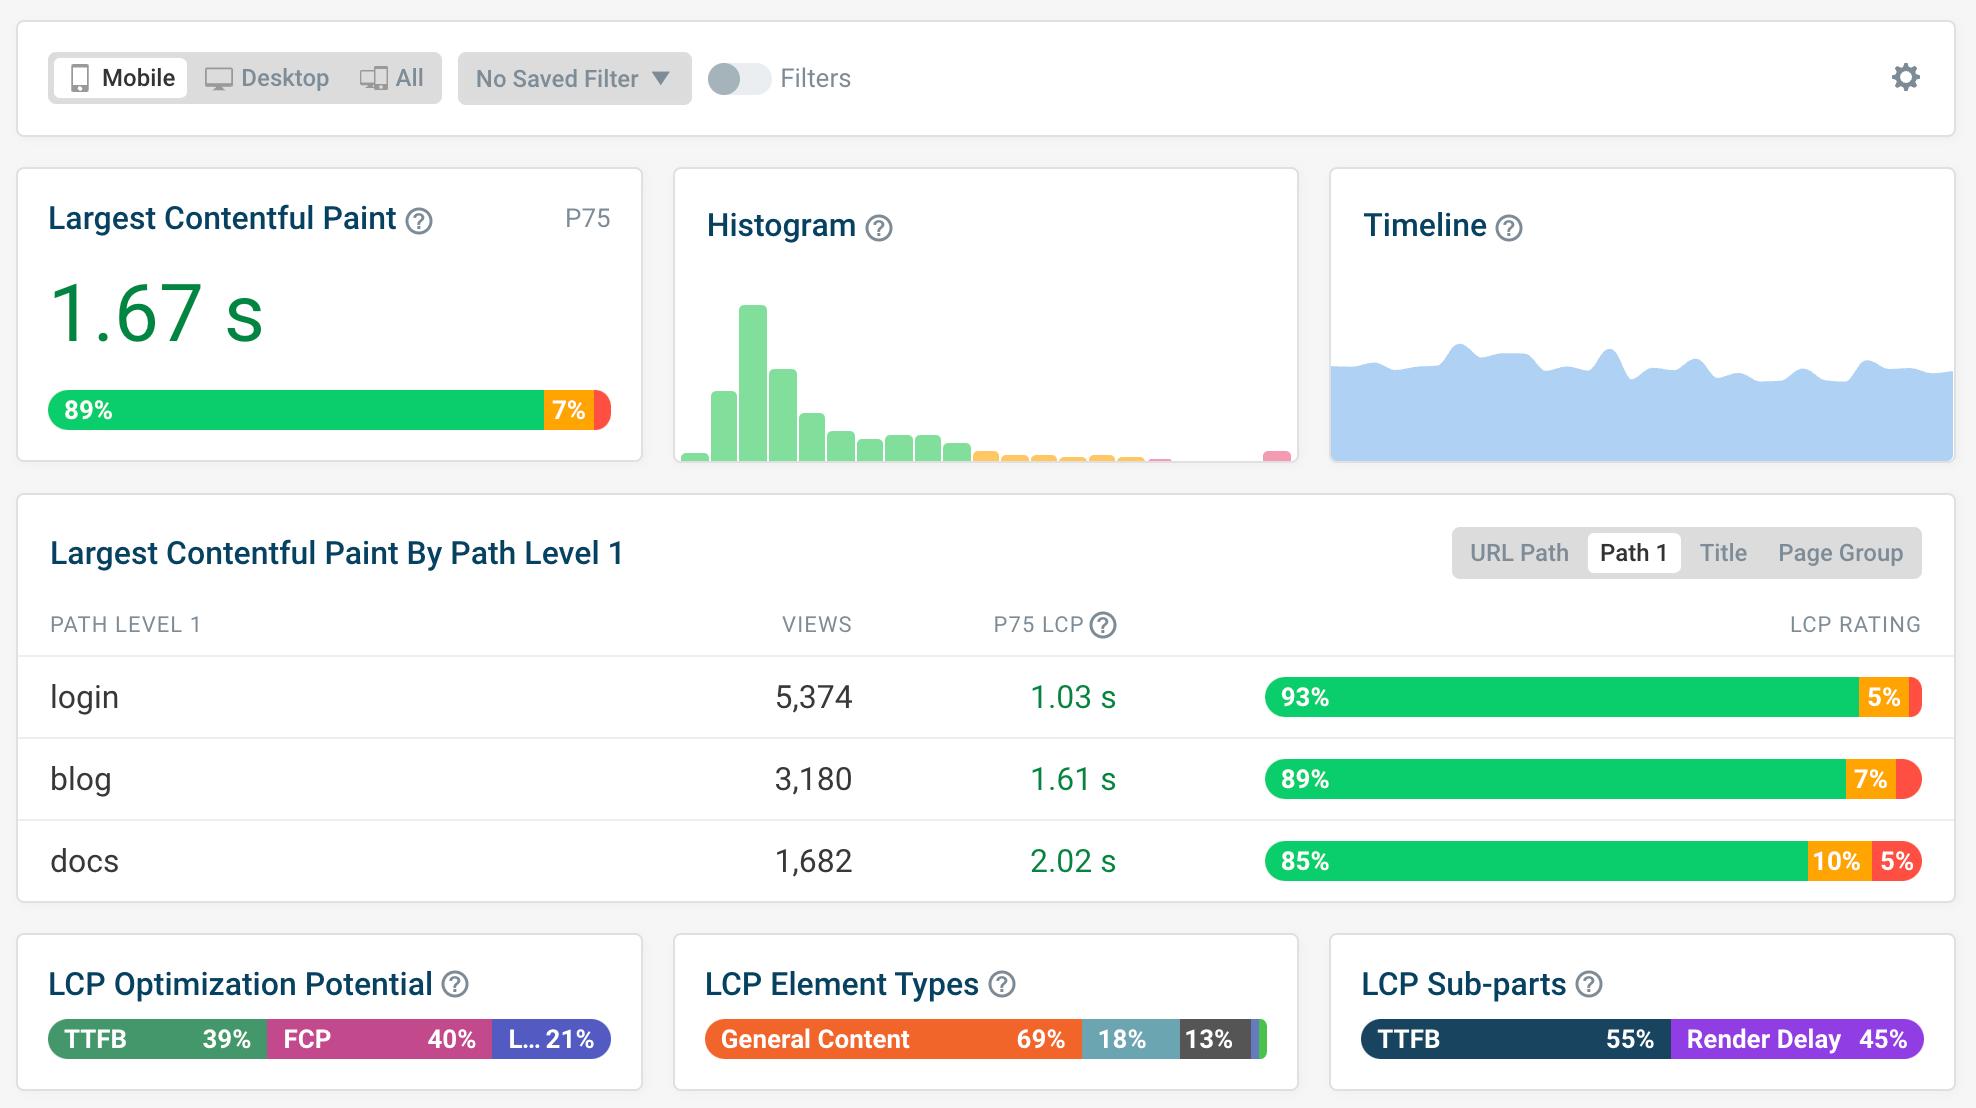
So far, we've been discussing lab data, which is collected in a controlled environment. It's possible to have fast loading websites in a lab environment but slow loading websites in the real world. You should collect data from both lab and field environments to get a complete view of your site's performance.
It's important to understand the difference between lab and field data:
- Lab data: Collected in a controlled environment, useful for consistent testing and debugging
- Field data: Collected from real users, provides insights into actual user experiences
DebugBear provides both types of data, giving you a complete view of your site's performance.
Summary
This post covered some key aspects that may affect the performance of your website. You learned about reading network request waterfalls and the tools and techniques you can use to monitor and mitigate performance-related issues. You should note, however, that finding, understanding, and fixing problems is just one part of maintaining website performance. A real-world website also needs to be continuously monitored for potential performance issues to help avoid regressions over time.
This post is sponsored by DebugBear. DebugBear helps website developers deliver a better user experience and pass Google's Core Web Vitals assessment. Get detailed page speed recommendations and continuously monitor synthetic and real user page speed metrics.