
How to debug mobile apps across devices
Bugs in mobile apps negatively impact user experience, often affecting visitors' first impressions and increasing uninstall rates. When users encounter bugs, they frequently choose alternative apps, leading to lost customers and revenue.
Therefore, businesses should focus on developing robust and bug-free apps as part of a strategy to retain customers. Debugging across the many types of devices visitors use is challenging but essential for maintaining long-term user experience, making mobile app testing a critical component of the process.
What is mobile app debugging?
Mobile app debugging is the process of finding and fixing bugs, ideally before releasing them to users. Bugs are often attributed to failures in functional processes. However, that is frequently not the case.
For example, excessive response time for an API can be classified as a bug, but it doesn't relate to the core functionality of any modules on a mobile application. Along the same lines, debugging may not always mean fixing the functional aspects of a mobile app, but rather fixing any application issues that have a user impact or even implementing fixes that prevent problems from occurring down the line.
Typically, developers use debugging techniques to see how features and fixes behave in real-time as they're being developed. Testers use debugging to explore vulnerabilities and how an app handles usage that may be unexpected or unforeseen in the development phase, often leveraging a real device cloud to ensure thorough testing across various environments.
Why debug mobile apps on multiple devices?
As stated above, the steps of the debugging process may not be the end of the mobile app debugging cycle. An additional parameter to consider in the debugging cycle is the existence of thousands of types of mobile devices.
For instance, in the snapshot below, consider just the screen size as a differentiator in these three devices and observe how the UI design should change accordingly:
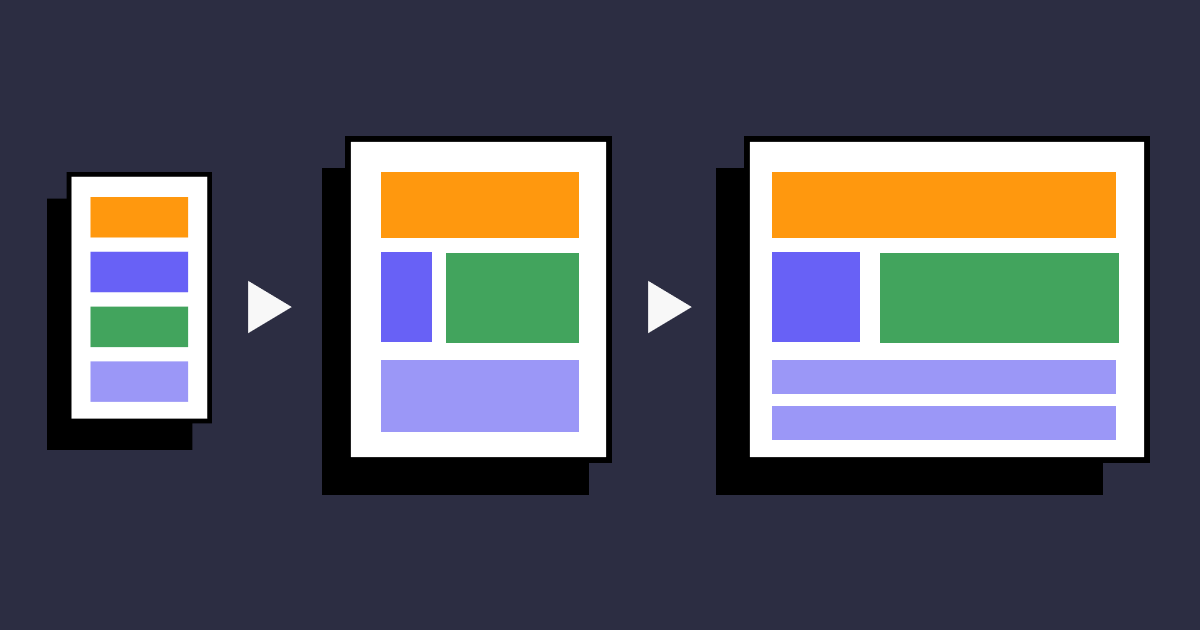
Screen size is only one area where a mobile device can differ. If you consider other device characteristics, debugging on multiple devices early in the development lifecycle becomes increasingly important. Let's look at some ways that devices may be unique:
-
Extremely high device fragmentation: Devices today come with unique specifications, and each of them affects the presentation of an application.
Some may have different screen sizes, while others work on different processing powers. This makes the compilation, execution, and operation of the application vary on various devices. -
Variation in operating systems: The StatCounter report puts Android and iOS at 99.34% of the world's mobile market share. However, it's more complicated than testing on two OSes, as each operating system ships a new version to end users yearly.
Each new OS version includes deprecations, newer APIs, and optimizations in existing methods. These changes affect how applications work and are developed and are a potential cause of bugs. -
Vendor UI modifications: The Android operating system is open-source and welcomes downstream modifications according to mobile manufacturers' requirements.
An excellent example of this is Samsung's One UI. The company uses the source code of the newly released Android and makes changes to the UI in-house. This makes their devices different from those of other manufacturers. Still, a tester should understand that such changes happen because UI elements are designed and analyzed differently in One UI as compared to in 'vanilla' Android.
Therefore, vendor-specific changes can cause bugs in an application's UI, making it an essential action item in the testing and debugging cycle. -
Considerable system changes: Many manufacturers have changed the general design of Android (including core kernel functionality) and incorporated that into their devices. An example of this modification is the OxygenOS from OnePlus.
This OS modification can affect the functional aspects of a mobile application, making it work differently on certain operating systems compared to Android. -
Hardware optimization: Many device manufacturers hire specialists who optimize hardware based on their software for increased performance. Optimizations include complete SOC design and development, custom battery discharge rates, and managing heat dissipation.
All these factors are critical to mobile app behavior. Therefore, a bug on one device may appear (or not appear) on another due to these optimizations.
When the above points are combined, it should become more apparent why each device, no matter how different it is from another, must be placed in a device farm and incorporated into all debugging cycles.
How to debug mobile apps on multiple devices?
Once a bug is found, use one or more techniques and strategies to expose its root cause, tracing the flow from the source to the output (the bug itself).
Debugging techniques and strategies
The following techniques (one or more) are helpful in debugging mobile applications:
-
Trace log files: Ideally, log files provide enough information to understand how execution flowed from a user action to a bug. Sometimes, the error is also logged with a description.
These are rare scenarios, however. Most of the time, log files only provide the code flow and specific values of variables at various points in execution.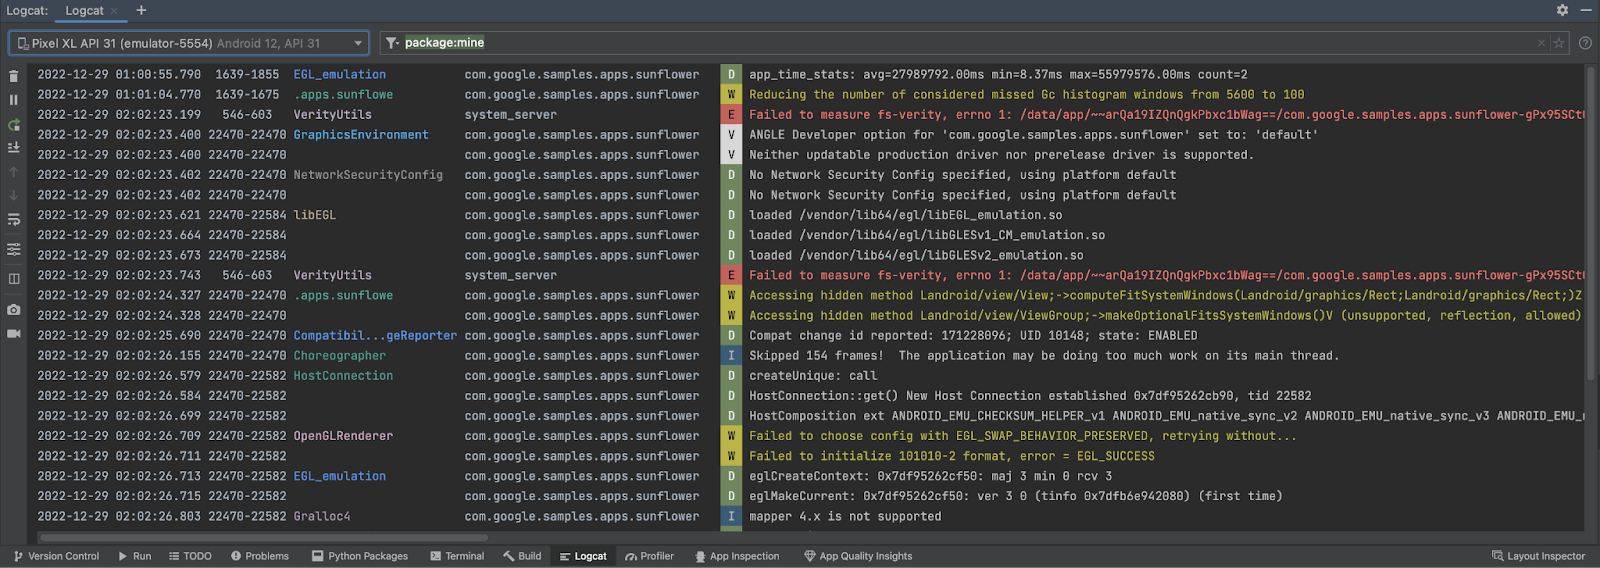
"Debug"-level logging, which is disabled in production but enabled during debugging, can greatly assist troubleshooting during mobile app development.
-
Use breakpoints: Modern mobile app development IDEs have a breakpoint feature in the source code. Breakpoints work by pausing the program execution at a specific point (called a breakpoint).
Once the program pauses, the developer can witness the complete flow from that point onward in single steps (each line of code as it executes) and determine the buggy line of code.
-
Analyze variable values: Many problems arise due to incorrect variable values. Analyzing variable values at different points can help track down the specific section that affected their values. Developers can isolate a program section to narrow down and identify the problematic line.
-
Analyze stack trace: Stack traces are the method calls with information about these calls printed on the console. These are often found when there is a "Warning" or "Error" during the execution of the program. The developers can trace the root cause with the file name and line number by analyzing these messages and printed errors.
However, this technique may yield fruitful results only sometimes. As mentioned before, all bugs in mobile apps are not necessarily functional. In cases of logical bugs, there will be no stack trace because nothing went wrong functionally to raise the errors; therefore, this method will not be able to provide any results. -
Involve exception handling: Exception handling is a recommended code development practice to ensure the code always exits gracefully. While debugging the applications, developers can look for exceptions inside the log file to understand what went wrong during program execution. The exceptions are primarily specific to the error (such as ValueError) and can decode the root cause quickly if clubbed with logging statements.
-
External debuggers: For any popular IDE you are using to develop a mobile application, at least one third-party debugger is available as an extension. In many cases, the debuggers are embedded inside the IDE by default. Such debuggers have functionalities to facilitate the debugging process.
For instance, each function or file provides all the variable values, pictorial representation of functional flow, and memory usage. Using an external debugger that complements the IDE is an excellent technique for mobile app debugging.
Debugging tools for mobile apps
Developers and testers can leverage the following tools to debug mobile apps across devices:
-
Android Studio: Android Studio is an IDE optimized for Android applications, providing a powerful platform for debugging mobile apps. It allows developers and testers to debug apps by plugging them into the system where Android Studio is installed.
It offers features like enabling breakpoints to pause program execution, logging, and variable analysis, and can debug applications during runtime. -
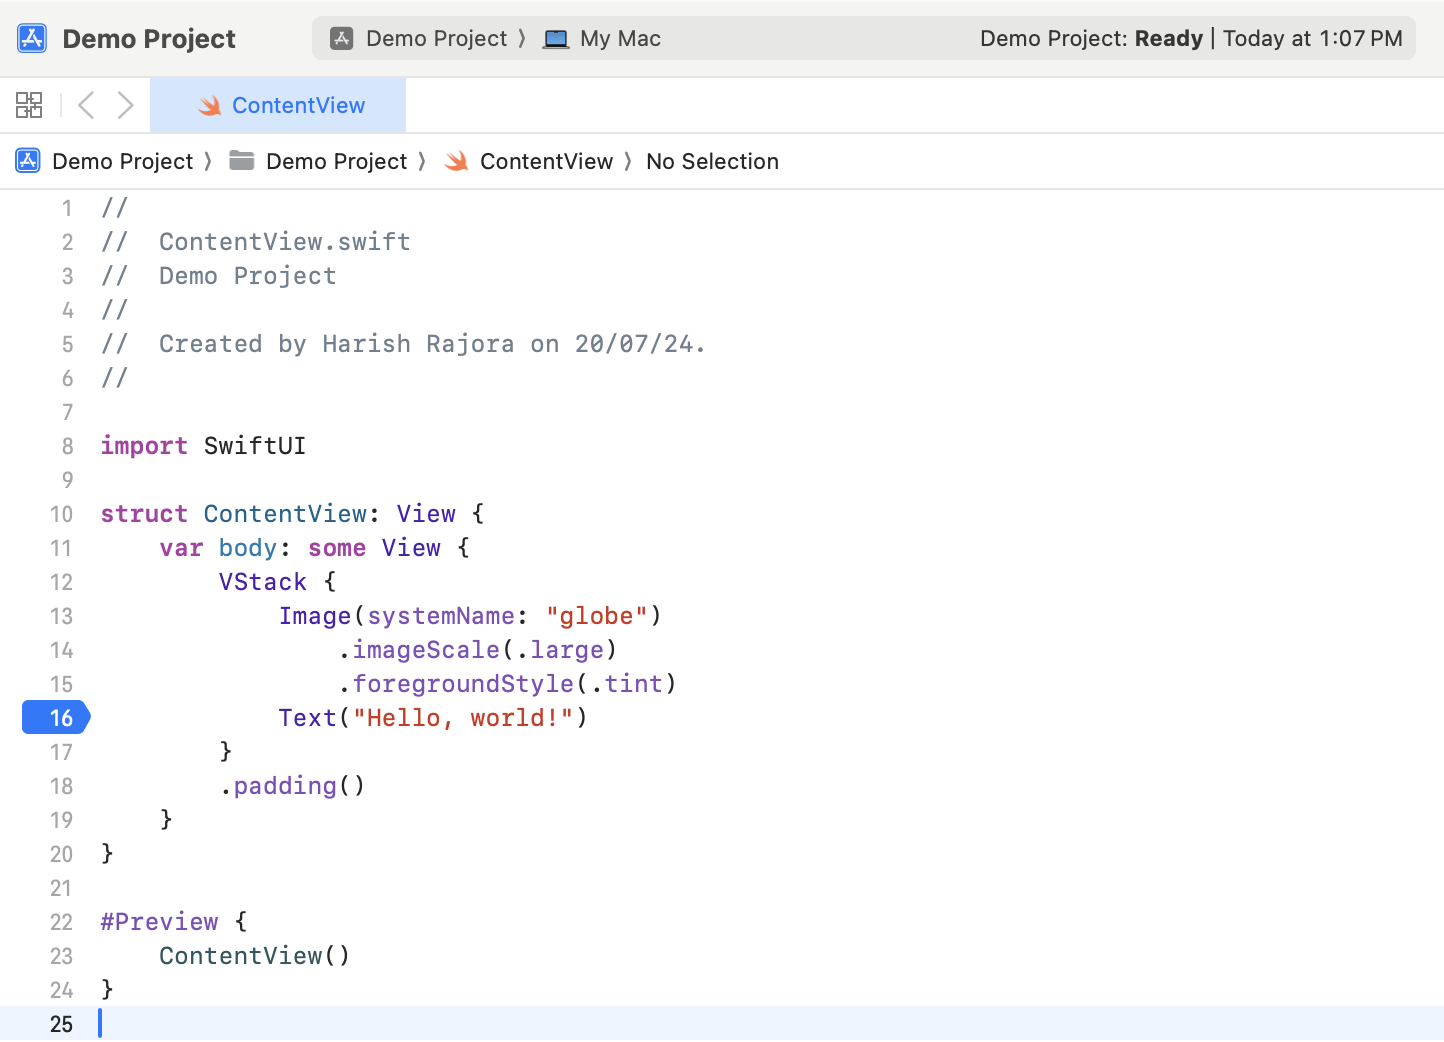
Xcode: Xcode is an IDE with robust debugging capabilities for Apple-based OS. The main features of Xcode include code suggestions and highlighting to avoid bugs based on syntax and programming practices, the ability to set breakpoints for detailed program execution analysis, and more.
-
TestMu AI: TestMu AI is an AI-driven testing platform that allows developers and testers to debug mobile apps on a virtual and real device cloud of 10000+ latest and legacy real Android and iOS devices.
It integrates seamlessly with various app distribution platforms wherein you can debug apps by installing them from the App Store, Google Play Store, App Center, and TestFlight. TestMu AI provides a UI Inspector for Android and iOS devices for mobile app debugging, reducing time to identify and resolve root causes. You can test natural gestures and interactions, QR code and image captures, biometric authentication, and more.
Beyond the above tools, developers and testers can enhance their app debugging process by combining test automation and leveraging features like auto-healing, which automatically detects and fixes issues in test scripts, and AI-driven Root Cause Analysis (RCA), which quickly identifies the underlying causes of test failures and suggests fixes, ensuring efficient and reliable debugging and mobile app testing.
Debugging process for mobile apps
Once you select a debugging tool, you can kick-start your mobile app debugging. Here is how to perform debugging for your mobile app:
- Execute functionality: Testers run the app's features following documentation and acceptance tests.
- Find and document the bugs: Test cases are executed; found bugs are recorded in the bug database.
- Find the root cause if possible: Testers document scenarios for developers to identify and fix the root cause of bugs.
- Fix the bug: Developers address and fix bugs by merging updated code into the source codebase.
- Validate and close: Testers revalidate the fixed code and close the bug if requirements are met.
- Explore for future bugs: Analyze past bugs and tests to anticipate and prevent future issues.
Summary
Development and debugging go hand in hand in every sprint/release cycle. Accelerated debugging without compromising on quality enables enterprises to ship exceptional products faster and with confidence. By combining test automation with features like auto-healing and automated Root Cause Analysis, developers and testers can ensure efficient testing, leading to faster app development cycles, reduced maintenance efforts, and improved overall app quality.
This is a sponsored article by TestMu AI. TestMu AI (Formerly LambdaTest) is a Full Stack Agentic AI Quality Engineering platform that empowers teams to test intelligently and ship faster. Engineered for scale, it offers end-to-end AI agents to plan, author, execute, and analyze software quality. AI-native by design, the platform enables testing of web, mobile, and enterprise applications at any scale across real devices, real browsers, and custom real-world environments.