
Developer essentials: JavaScript console methods
Building on our previous "Developer essentials" post on grep, we're looking at an API you'll always rely on when building for the web: the humble console. The console is where you experience delight when you see your JavaScript working, and sorrow when all you find is a cryptic error message.
People use the console to log outputs such as a calculation's result, a REST API's return value, the outcome of string manipulation, a reminder to revisit a certain part of a program (e.g., TODO: fix). The possibilities are endless.
You can use the console to output any kind of information you like. When running JavaScript in your browser, console logs are visible in your browser's developer console.
In this article, we'll take a look at what the console can do and some of the lesser-known methods that you might find useful or just plain fun. Whether you're a beginner in web development, seeking to learn the purpose of the console, or an experienced developer, you might discover methods that you didn't know existed. Let's start off with the most common methods and then take a look at the others, with examples all along the way.
Logging to the console
If you know all about console.log(), you can skip to logging levels as we'll quickly cover the basics first.
If you're still here, let's learn about what the console is and how it's used.
Most people use console.log() to send generic information about their code to the console, which you can find in your browser's developer tools (e.g., Firefox's Developer Tools).
Note: You can copy and paste all of the examples below into your browser's console and try them out for yourself.
The log() method is the bread and butter of the console object: you provide something to log(), and voilà — it's logged to the console:
const hello = "Hi there, welcome to MDN Web Docs!";
console.log(hello);
// Hi there, welcome to MDN Web Docs!
It's great to find out if your code is working as expected by making the output visible, like this example where I'm checking if I correctly used DateTimeFormat:
const currentDate = new Date();
const formattedDate = new Intl.DateTimeFormat("en-US").format(currentDate);
console.log("Current date:", formattedDate);
// "Current date:" "11/28/2023"
You can provide multiple items in the log and apply some fancy formatting as well (for more details, see Outputting text to the console):
const currentDate = new Date();
const formattedDate = new Intl.DateTimeFormat("en-US").format(currentDate);

console.log("Today's date is %s", formattedDate);
// Today's date is: 11/29/2023
It's also fun to use the console interactively as most browsers support autocomplete that lets you tab through suggestions.
If you don't know what to log, type console.log(window. (or any other object) and let browser suggest some interesting capabilities, like the navigator:
console.log(window.navigator.oscpu);
// Intel Mac OS X 10.15
Don't forget to get rid of leftover console.log() calls in your code before you make it public, though! It's good practice to remove development logging from production applications.
Logging levels with info, warn, and error
You can add more meaningful logs with info, warn, and error levels by using console.info(), console.warn(), and console.error() methods.
The effect is similar to console.log(), but the output is formatted differently (depending on the browser), and usually you can filter the output by logging level.
This is useful if you only want to see errors, for example:
const browser = window.navigator.userAgent;
console.info(browser);
// Mozilla/5.0 (Macintosh; Intel Mac OS X 10.15; rv:121.0) Gecko/20100101 Firefox/121.0
If you know of cases where other people might run into trouble when running your code, warn and error messages are extremely helpful.
console.warn("Unknown device - there may be compatibility issues.");
// ⚠️ Unknown device - there may be compatibility issues.
console.error("Unsupported device. See <docs url> for more details.");
// 🛑 Unsupported device. See <docs url> for more details.
//    <stack trace>
Some browsers show a stack trace for error messages, but you can also call this feature directly using the console.
We'll see how to do this later in this article in Creating traces using console.trace().
Displaying tables using console.table()
This is one of my favorite methods because I often find that I need to take the output of code, copy and paste it into an editor, and then spend some time formatting it to make it readable before I can understand what's happening.
The amazing thing about the console is that you can create tables directly in the console using console.table().
This makes perfect sense because usually you're running the code in the browser, and browsers can handle rendering tables pretty well already:
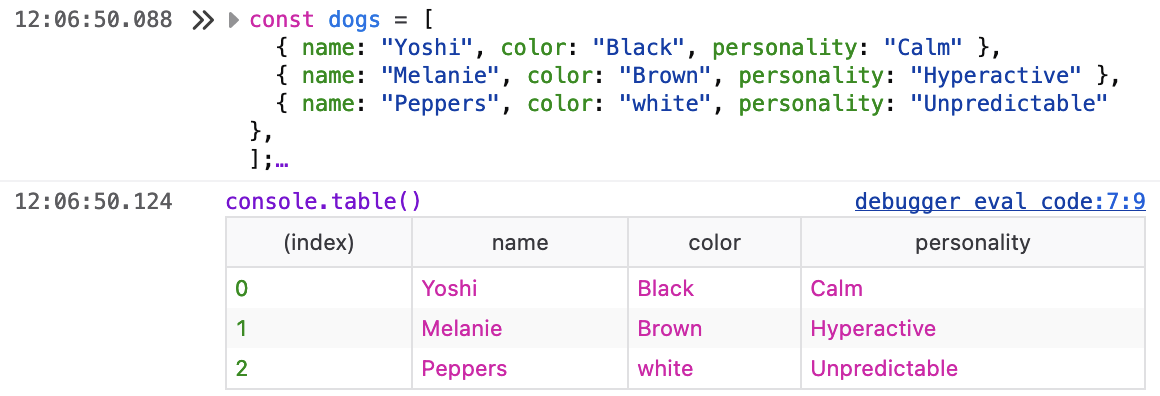
const dogs = [
  { name: "Yoshi", color: "Black", personality: "Calm" },
  { name: "Melanie", color: "Brown", personality: "Hyperactive" },
  { name: "Peppers", color: "white", personality: "Unpredictable" },
];

console.table(dogs);
Check out how this array looks when it's beautifully formatted as a table:
Counting using console.count()
Why not add a counter to your logs to find out how often something happens?
console.count() is a great built-in method that you can use to count events away to your heart's content:
function postBoostClicked() {
  // My post has been boosted, do something here
  console.count("Boost count");
}

postBoostClicked();
// Boost count: 1
postBoostClicked();
// Boost count: 2
Adding timers using console.time() and console.timer()
Two useful methods applicable in many situations are console.time() and console.timeEnd(), which start and stop a timer within your program.
You can use these methods to measure how long something takes in your code, say you want to see how long it takes to execute a function.
In this example, a function called myFunction() takes 200ms:
console.time("timerName");
// call myFunction()
console.timeEnd("timerName");
// timerName: 200ms - timer ended
If you find that you need to add some details with timing, you can also add notes using console.timeLog().
This is useful if there are separate stages in your application like setting up different parts of the app:
console.time("MyTimer");
console.timeLog("MyTimer", "Starting application up…");
// MyTimer: 0ms Starting application up…
// call myFunction(), for example

console.timeLog("MyTimer", "UI is setup, making API calls now");
// MyTimer: 200ms UI is setup, making API calls now
// call otherFunction(), for example

console.timeEnd("MyTimer");
// MyTimer: 300ms - timer ended
If you're interested in measuring your code beyond internal timers, you might want to look at the Performance API, which helps dig into application performance based on various standards and measurements.
Grouping logs using console.group()
Grouping logs using console.group() and console.groupCollapsed() is a great way to organize the output if you're creating a lot of logs.
If you have stages that your code goes through, like setup steps or different processing tasks, grouping logs can be very convenient.
Groups are collapsible, meaning you can expand and collapse a group in the console if you want to show or hide logs, especially if there's a lot of information to sift through:
console.group("Grouped Logs");
console.log("Log 1");
console.log("Log 2");
console.groupEnd();
// Grouped Logs
//     Log 1
//     Log 2

console.groupCollapsed("Collapsed Group");
console.log("Log 3");
console.log("Log 4");
console.groupEnd();
// > Collapsed Group
Creating traces using console.trace()
This method is an excellent choice for situations where you need to explore how the code is behaving.
When you use console.trace(), you're venturing into debugging territory and need to investigate where code is being executed.
Tracing is very handy if there are complex conditions that are difficult to follow mentally just from reading the code.
The following example shows how to add a trace to an example function (example()) to find out whether it's being called from one() or two().
There's a condition that flaps between true and false based on the time, so it's impossible to know whether one() or two() will call the function we're interested in:
// Is the "currentSeconds" value odd or even?
const currentSeconds = new Date().getSeconds();
const condition = currentSeconds % 2 === 0;

function one() {
  example();
}
function two() {
  example();
}
function randomChoice() {
  if (!condition) {
    // OK, I'm lost!
    one();
  } else {
    two();
  }
}

function example() {
  // Where is this function called?
  console.trace("Trace from example() function");
}

randomChoice();
//  console.trace() Trace from example function
//     example debugger eval code:23
//     one debugger eval code:6
//     randomChoice debugger eval code:16
From the trace, we can see that:
traceis executed insideexample()on line 23example()is called in theone()function on line 6- The trace ends with the call of
randomChoice()on line 16
If you have code with complex logic or non-deterministic behavior, using console.trace() can be really helpful for working back through the stack and finding out the potential source of issues.
Cleaning up using console.clear()
Are you working with an application that logs too much information to the console for you to focus on a specific area or message?
You can conveniently clear the console and restore it to a pristine condition using console.clear():
// Too much information!
console.clear();
// Console was cleared.
The zen of an immaculate, clear console seems like a great place to conclude this article. So let's wrap it up here.
Summary
We've seen quite a few different ways of using the console in JavaScript.
I hope you've learned something new, whether you're starting your web development journey or are an old console.timer().
If you think I've missed something worth mentioning, or if you have other feedback about this article, feel free to let us know on Mastodon or Discord.
Thanks a lot for reading, and happy logging. 📒